Segments Analytics by Tresl
Designed an analytics experience that helps Shopify merchants turn complex customer data into clear actions.
2025

My Role
At Tresl, I am the product designer for Segments Analytics. I own the end-to-end design process—from research and wireframing to maintaining a scalable design system, developer handoff, and release QA.
More recently, I have also used AI to build interactive prototypes, helping the team test and communicate complex interactions earlier.
Challenge
Shopify merchants have access to a lot of customer data, but many have little data analysis experience, do not write code, and do not have time to study complex reports. Even when insights are available, they often cannot tell what the findings mean for their store or what to do next.
Our challenge was to make customer data easier to access, understand, and act on.
Approach
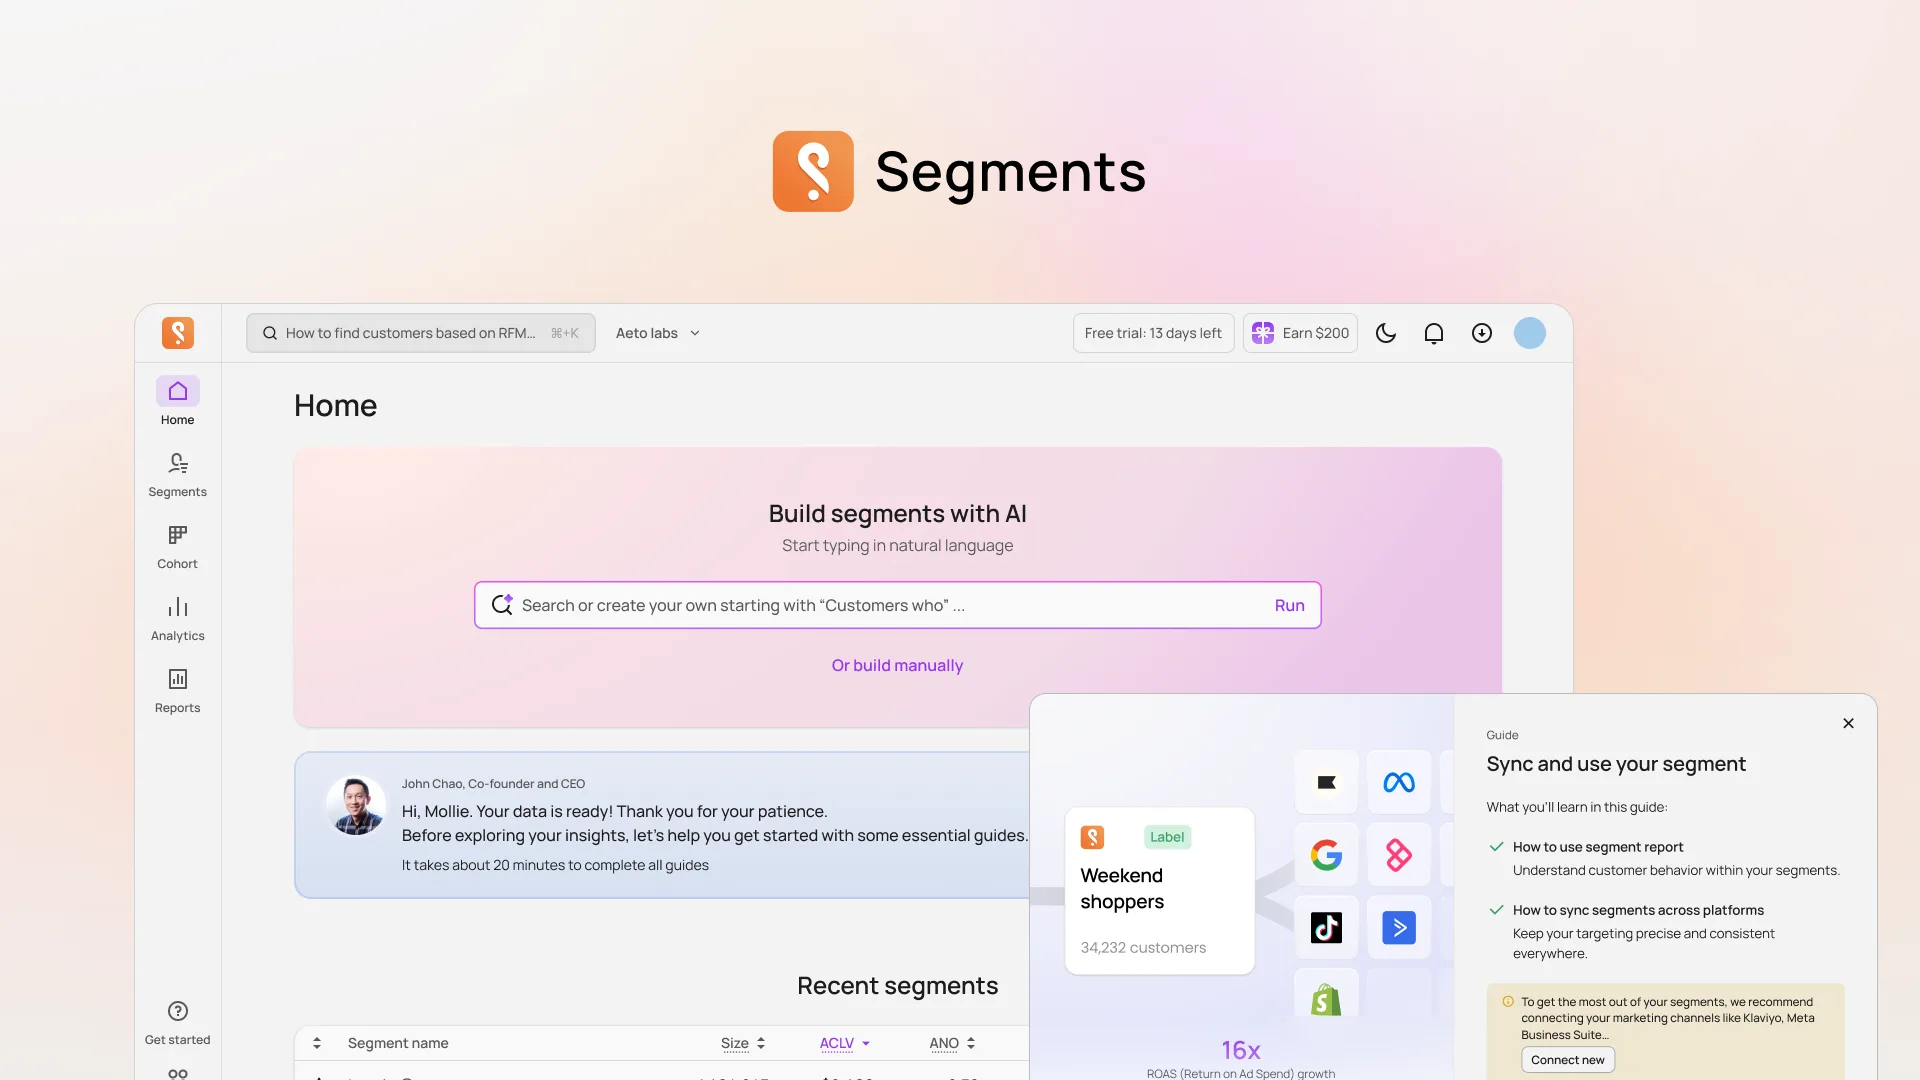
We focused on three moments in the product experience: waiting for store data, building a segment, and deciding what to do with a report.
Making onboarding useful while data processes
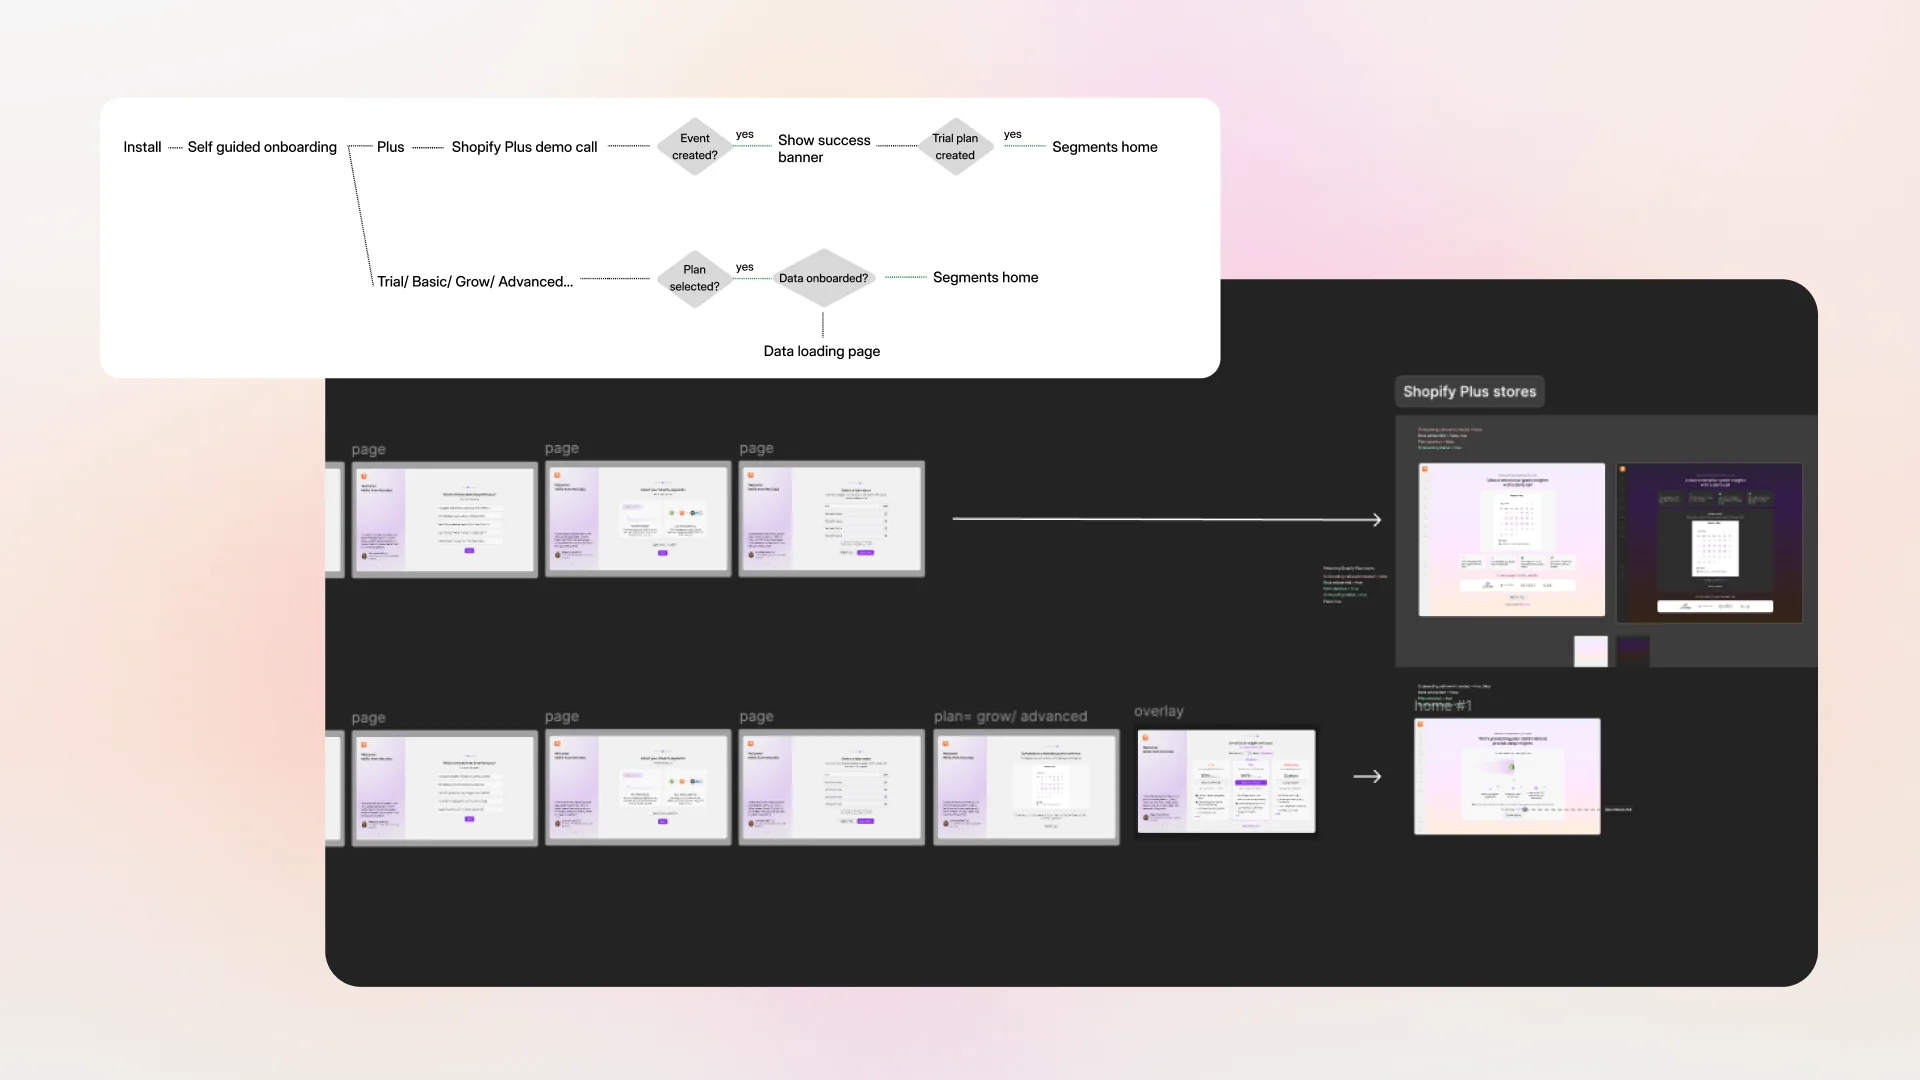
After installation, Segments needs several hours to ingest and process a store’s data. Fullstory funnel reports showed that many merchants dropped during this waiting period and did not return when their data was ready.
Since we could not remove the processing time, I redesigned onboarding around useful setup tasks. Merchants could connect a marketing integration or import existing segments from Shopify while they waited, preparing their account before the analytics became available.
Fullstory funnel reports showed that the new flow produced a 30% relative increase in activation rate.
- relative increase in activation rate
- 30%
Designing for uncertainty in an AI flow
FilterGPT, our natural-language segment builder, turns a merchant’s description into filter rules. I designed the experience from input to output, including loading, success, error, and long or complex result states.
Since AI responses are not always predictable, each state had to make the result understandable and give merchants a clear next step.
Instead of working through the full filter composer, merchants could describe the audience they wanted in everyday language. We also kept the manual builder available when they already knew the exact conditions they needed.
After launch, usage patterns showed that merchants relied on FilterGPT for more complex segment filters, while the manual builder remained useful for precise requests.
Turning lifecycle data into the next action
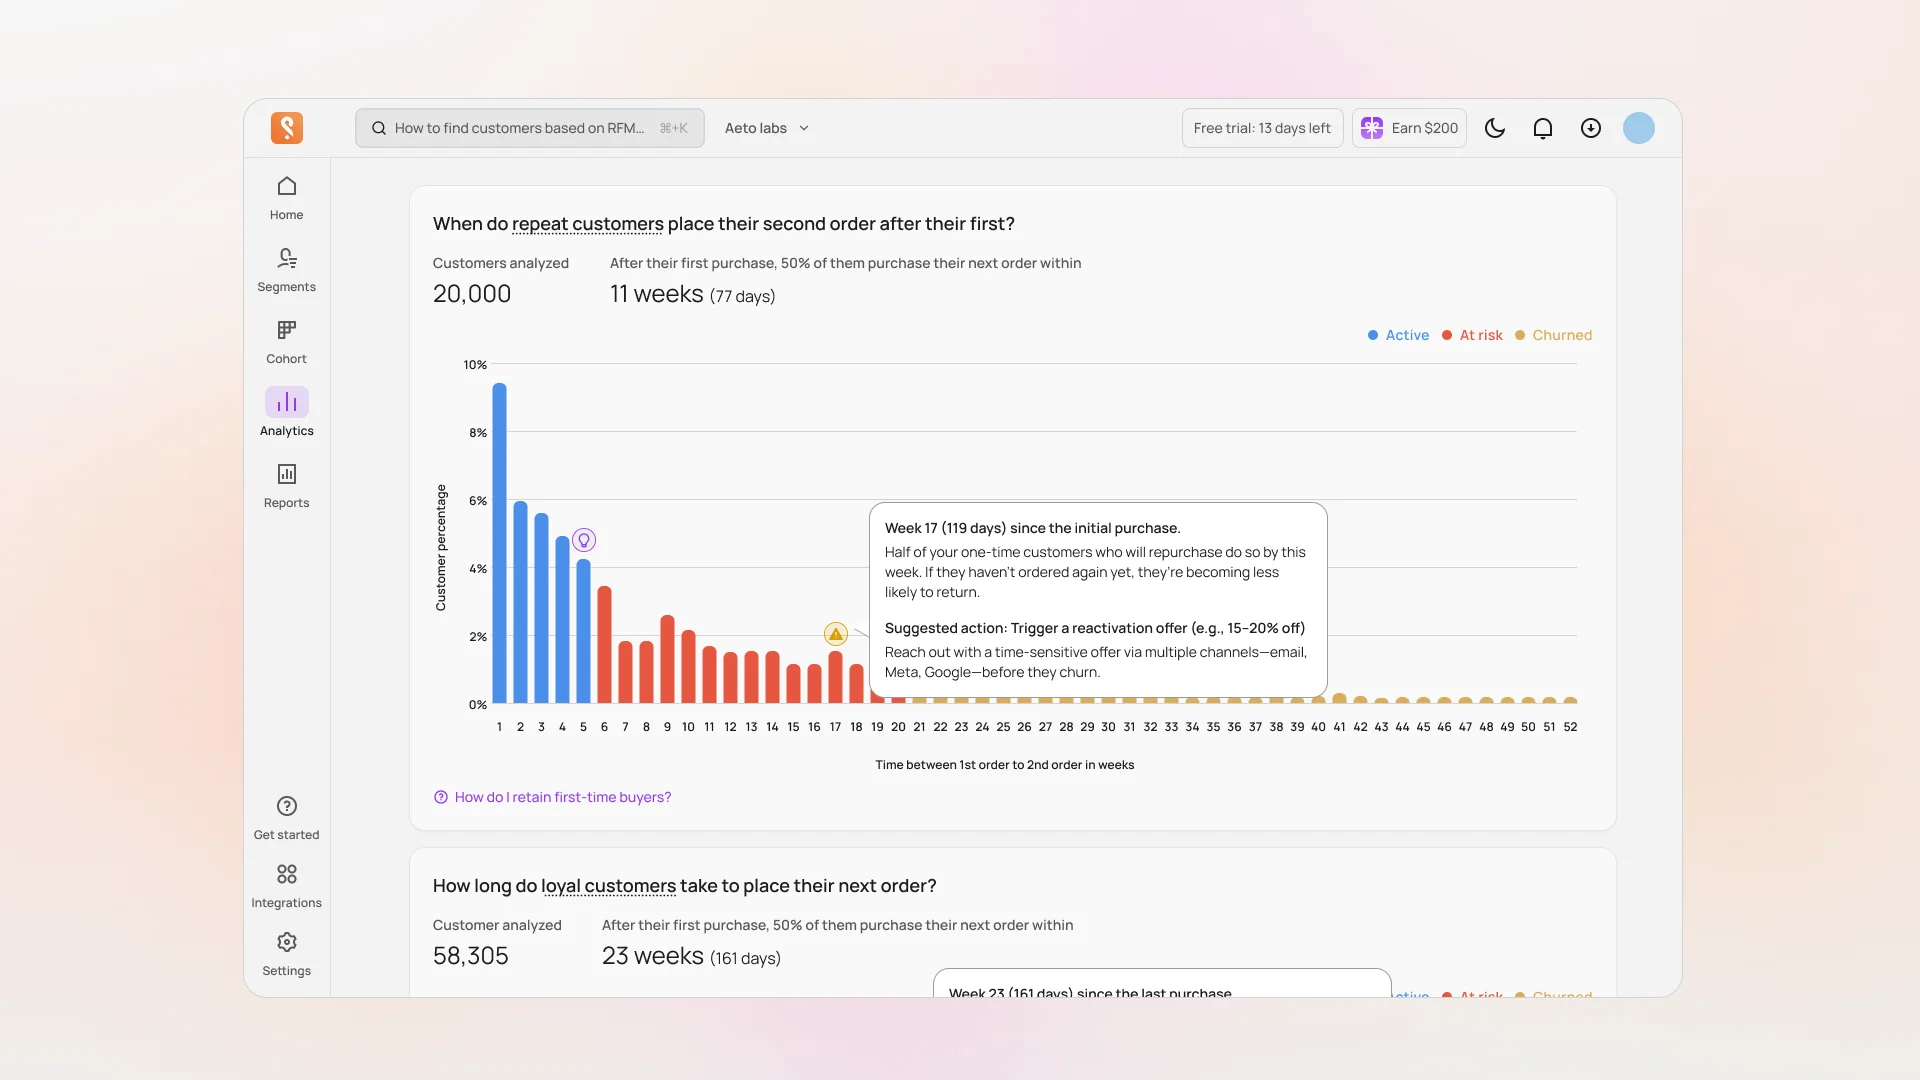
Lifecycle Journey maps customers across purchase frequency and recency. Many merchants had trouble reading it and contacted support to understand what the report meant.
I reviewed user interviews and support conversations to identify the questions merchants asked most often. I found that the larger problem was not simply reading the chart. Merchants did not know how to use it to decide what to do next.
I rewrote the report around the questions merchants were trying to answer and worked with the data team to place actionable insights directly in the charts.
After the update, customer questions about how to interpret Lifecycle Journey dropped to zero.
Impact
Together, these changes helped merchants reach value earlier. They could make progress while their data was processing, build complex segments without code, and understand what to do next from each report.
Segments became less about showing more data and more about helping merchants act on it.